Demographic Studies:
Demographers: Are We Getting Our Money's Worth? (written in 2006)
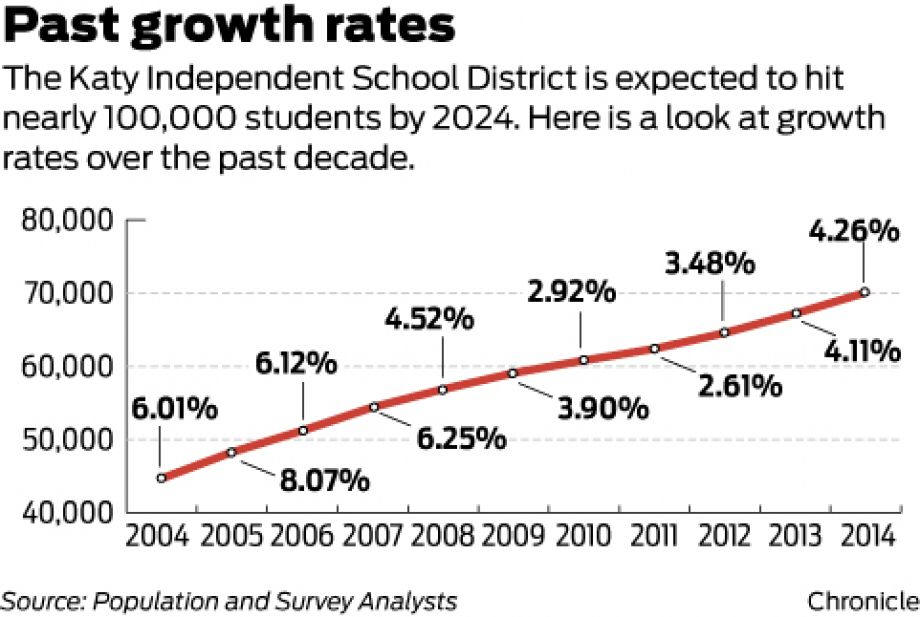
Katy ISD uses as its demographer, Dr. Pat Guseman. Dr. Guseman's firm, Population and Survey Analysts, is used by a great many Texas school districts. In my opinion, projecting school enrollments farther ahead than about a month, is pretty much pseudo science. School districts feel they have need of demographers more than in the past because they have changed the reasons for building new schools. Schools now are built to accommodate whichever developer can coerce the Superintendent and his compliant Board members into thinking they need new facilities/schools/repairs of one sort or another. Previously (at least until I left the Board in 1996), KISD schools were usually built when there were enough students living in an area to fill them up. That was a prudent policy for a governmental body such as Katy ISD, and it worked. Students moving into an area were bused to the school closest to their home until the time came to build a school nearer their home. We didn't ordinarily build schools before the students were there to fill them.
Last year as part of my commentary on the proposed bond initiative, I wrote this article because the Houston Chronicle had just posted that Katy ISD's "projected enrollment for the 2007-2008 school year indicated they were expecting 53,956 students on August 27th. In the summer of 2006 at the bond committee meetings, the committee members were told by our demographer (same one we have now) that 52,937 students would be there. So not only were the bond committee members misled, once again, but the District appears to be short the equivalent of one full elementary school when school opens this year. Obviously, depending on the demographer's numbers as well as building before the students are here and we know where they live, is not good policy. Below is a reprint of an article I wrote a year ago.
In the tables below, one can see the actual enrollment figures at the beginning of the
year (or as close to the beginning as I could find) for the years listed. Also, listed
below are the demographic projections at various times in the last ten years. One can see
the predictions of Dr. Pat Guseman (formerly Pat Guzman) of PASA (Population and Survey
Analysts) (www.pasademographics.com/ ). Dr.
Guseman has been predicting demographic figures as KATY ISD’s consultant since 1997.
Before that time, Texas School Planning, Inc(TSPI) was the demographic consultant for the
District. TSPI was located in San Antonio. The president of that company was Bill Rives,
Ph.D., George V. Shaw was Executive Vice President and was a CPA, and Wendell Davis, AICP
was the Vice -President in charge of
planning.
In looking at the tables, one can see that these demographic predictions, for which the District pays a tidy sum each time they are assembled, are not very accurate, and leave a great deal to be desired if the District is going to base projections of needed school construction upon them. In fact, in my opinion a crystal ball would be just about as useful as these predictions.
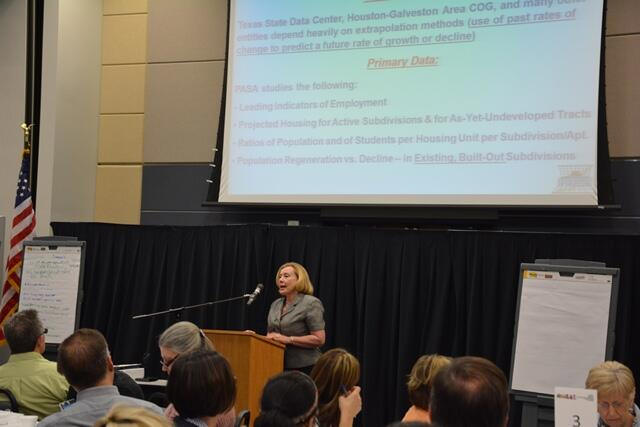
Of interest to me as a spectator at the first 2006 Summer Bond Committee meeting was a statement made by Dr. Stacey Tepera, associate staff member at PASA. In the Q&A session of the meeting she made the statement that the statistics provided by PASA had a "plus or minus 9% chance of being accurate." I thought I hadn’t heard her correctly, but a Bond Committee member sitting closer to her said, “If your statistics are that far off, we could be talking about as many as 4,000 students that we aren’t certain of.” The response of Dr. Tepera could not be heard by me. I was surprised that no reporter jumped on this significant matter, and no mention of the exchange was made in the District’s Q&A report.
Perhaps the demographic “studies” should all be taken with a grain of salt. To quote Kris
Taylor, KISD Director of Communications, in a Houston Chronicle
article on 7/25/02 “Guzman has provided demographic projections for the Katy school
district for five years. Her numbers have been consistently accurate, Taylor said.”
Perhaps Ms. Taylor doesn’t have a very good memory. I hope everyone understands that the
lack of authentic projections, the failure to predict with clarity, and the use of a
fallible science are being used to convince taxpayers that growth is coming when many
times it really is not. All of these figures go to the argument that portable buildings
might not be such a bad idea until we see real students who actually live in the District.
In 1999 the District suggested that there would be 48,776 students by 2005-2006. In
actuality, according to the KISD web site on September 24, 2006, the actual total for the
2005-2006 school year was 47,816 or a difference of almost a thousand students. That’s
equivalent to an entire elementary school! I would point out that the demographic
predictions over these years can be underestimated or overestimated which is an indication
to me that they have no value, and some better way of predicting the future needs to be
found if we are to continue building schools for the Katy construction industry. Whatever the reasons for the flawed predictions, one thing is clear to me: no bond
initiative construction projects should be based upon such predictions.
Over the last few years, one after another of our schools have opened and some have been half empty or more than half empty (Seven Lakes High School to name one; Tompkins High School for another). If there had been an economic downturn on which to blame such a situation, that would be understandable, but there has been no such problem in the last few years.
When the superintendent comes to the taxpayers and claims that tons of children are on their way and “we have to be ready for them,” a great many people swoon and clamor to give him as many dollars as he claims he needs, but should they? Voters need to ask themselves who really benefits from schools built too soon. I believe the answer to that question is quite obvious. If the School Board and its Superintendent have not done their homework over the years so that they know the demographic predictions are flawed, their leadership is subject to question. Bonds are passed for millions of dollars. Since Dr. Merrell arrived in Katy eleven years ago, he has had the opportunity to direct the spending of more than 920 million of our tax dollars. He and the Board are currently asking for 269.4 million more. If they succeed in getting this last request, the Administration will have had access to 1.2 Billion dollars. Dr. Merrell has suggested that they will be back for more in 2009. More means $400 or $500 million. They are saving the best for last. In the 2009 Bond Initiative look for a proposed new stadium that will be supported by all those parents who want their sons to earn college scholarships.
For 1.2 Billion dollars all we have to show for it are 13 elementary schools (we already had 14; 5 junior highs (we already had 5); and 3 high schools (we already had 3). The building of the first twenty-two schools only left us with a bonded indebtedness of $148,349,944 on 8/31/96 and an original cost of only $234,959,583 plus interest. (Source: pages pp. 84 and 85 of the KISD Comprehensive Annual Financial Report.) And almost all of the schools, with the exception of Wolfe Elementary, have had additions or repairs made to them in the last eleven years, so their actual original costs are less than indicated. The question the voter should have is “If the School District’s representatives offer flawed statistical numbers regarding enrollments, tax rates, and school capacities, do I really want to vote for a bond that is based upon what appear to be erroneous judgments?”
Number of Katy ISD
STUDENTS PREDICTED
By Year 1990,93 2002 2003
2006 ACTUAL2012**2012***2013****
1991
20,414 20,460
1992 21,494 21,659
1993 22,629
22,501
22,537
1994 23,950 24,032 23,745
1995 25,366
25,785 25,231
1996 26,766
27,400 26,597
1997 28,230
28,830 28,230
1998 30,126 30,188 30,126
1999
32,338 31,526 32,072
2000 34,798 32,832 34,503
2001 37,798 34,188 37,211
2002 39,524 36,385 40,058 39,478
2003
41,460 42,950 41,692
41,690
2004 44,212 46,327 43,841
44,212
2005 47,816
49,773 46,238 47,808
2006 50,992
53,106 48,644 50,161 50,725
2007 56,602
51,021
52,937 53,762
2008 60,184 53,612 55,676
56,191
2009
63,828 56,586 58,935
58,444
2010 67,428 59,498 62,279 60,260
2011 70,971 62,570 65,844 62,414
2012 65,946 69,906
64,249 64,135
65,009 62,829
2013 69,164
74,202 67,213 66,052
2014
78,677
67,788
2015 83,418 69,826
2016 72,581 76,581 69,956
2017 75,534
2018 78,209
2019 80,878
2020 83,635
2021 85,901 92,157 80,204
2023
2024
2025
2026
2027 94,000
*1990-1996 projections provided by TPSI (and are obviously considerably more accurate than
those made by PASA); Beginning in 1997 projections are provided by PASA. Projections for
2002 start in 2002. The school district’s Demographer consultant changes these
numbers from time to time depending on her projections. The predictions become more
accurate as they get closer to actuality which one would expect, but the District is
paying for long range predictions so that it can plan ahead (and only because the District
is trying to help builders sell their homes in new subdivisions). These predictions are a
moving target which makes comparisons and research very difficult. The lack of accuracy is
another prudent reason to put off construction until students are actually residing in the
School District.
**PASA moderate growth projections (It would appear that PASA is hedging their bets these days. Bond committees get to pick from the different projections! They also don't want to be pinned down every year!)
***PASA high growth projections
****PASA low growth projections
Demographic predicting is an imperfect science at best.
© 2006/2014 by Mary McGarr. All rights reserved
DEMOGRAPHIC UPDATE LINK MARCH 2014:
http://www.katyisd.org/dept/communications/Documents/102813%20Demographic%20Update.pdf
Demographic Picture of Katy:
From Ballot Pedia
Demographics
Katy underperforms in comparison to the rest of Texas in terms of higher education attainment but outperforms in terms of poverty rate and median household income. The 2010 U.S. Census found that 25.9 percent of Katy residents over 25 years old held undergraduate degrees compared to a 26.3 percent rate for the state of Texas. Katy had a median income of $69,279 in 2010 compared to $51,563 for Texas. The poverty rate for Katy was 10.6 percent in 2010 compared to a 17.4 percent rate for the rest of the state.
Eighty-two percent of new growth for the Katy school district comes from the subdivisions currently being built. Thirty-nine percent of KISD's subdivisions are already built out. Twenty-four percent of the school district is undeveloped. Twenty-one percent of the District lies in the the Parks/Preserves/Reservoir areas.